
Data is a critical factor in the design and implementation of Community Housing Connect 2.0. Careful and continued analysis of our current system has informed and driven the updates that will come with CHC 2.0.
Data gathered by CHC 2.0 will give our community valuable insights into how the system is being used and will identify areas for improvement. CHC 2.0 will provide real-time data to will show the community which resources are being used most and which may be underutilized. This will allow our community to monitor our homeless system performance, notice fluctuations, identify problems and respond in real time.
The following Stella reports have been provided by HUD to help our local CoC better gauge their progress toward preventing and ending homelessness. For more information visit the Grand Rapids Area Coalition to End Homelessness or visit The Hud Exchange.
The Longitudinal Systems Analysis (LSA) data contains community-level information on people and households during the reporting year.
For those people and households served during the reporting period the LSA System Performance map looks at three critical performance measures:
- Number of days homeless (Days Homeless)
- Exits from the homeless system to permanent destinations (Exits)
- Returns to the homeless system after exits to permanent destinations (Returns)
This pathway shows there were 3,962 Households served in the homeless system. This includes Emergency Shelter, Transitional Housing, Rapid Rehousing, and Permanent Supportive Housing. This does not include Outreach. Our community does not have Safe Haven project types. Coordinated Entry is not included in the LSA data as CE is not indicative of entry into the homeless system but rather an access point to get connected to services.
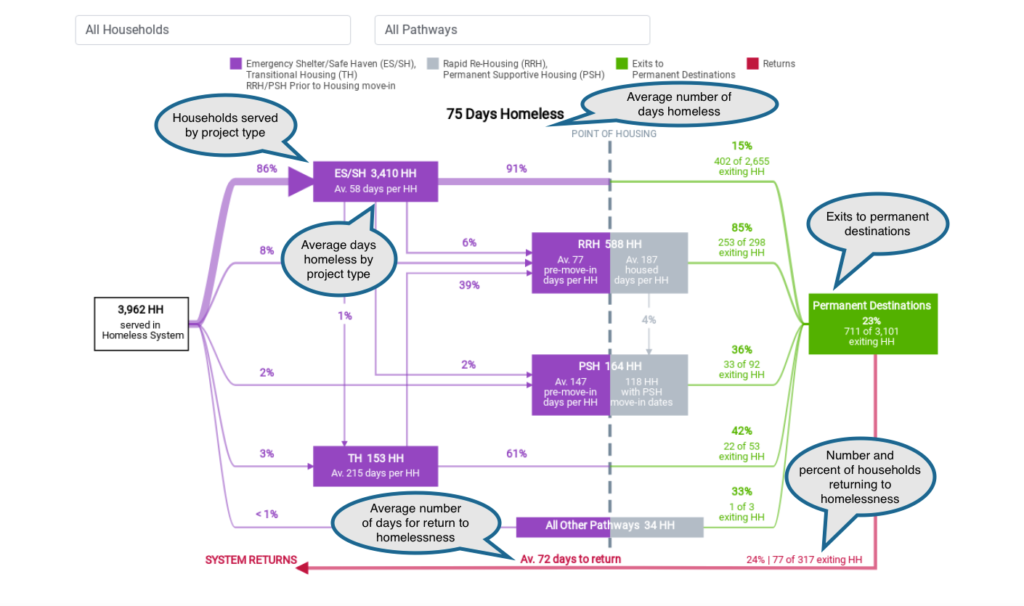
Households use different combinations of project types during the time they are served in the homeless system. These project type combinations are referred to as pathways. Each pathway has different average cumulative days homeless, exits to permanent housing and returns to the homeless system. The system map shows performance for the main project types in the homeless system and can be filtered to show performance for the main pathways
*This data is gathered and submitted by the Grand Rapids Area Coalition to End Homelessness